Fetching Historical Equity Data
Source:vignettes/Fetching-historical-equity-data.Rmd
Fetching-historical-equity-data.RmdIntroduction
The B3 (Brasil, Bolsa, Balcão) provides historical stock market data
through its COTAHIST files. These files contain valuable information
about stocks, ETFs, BDRs, UNITs, REITs (FIIs), FIAGROs, and FIDCs
trading on the Brazilian exchange. The rb3 package
simplifies access to this data through the templates
b3-cotahist-yearly and b3-cotahist-daily,
which handle the downloading and processing of these files.
The COTAHIST files represent one of the most comprehensive sources of historical market data in Brazil, with annual files available as far back as 1986. However, due to Brazil’s monetary stabilization process in 1994 (Plano Real), it is generally recommended to use data from 1995 onwards.
It’s important to note that the prices in these files are not adjusted for corporate actions, which means that for long-term historical analysis of individual stocks, additional adjustments may be necessary.
In this vignette, we’ll explore how to fetch, filter, and analyze
historical equity data using the rb3 package.
Fetching historical data
To access historical equity data, we need to download the COTAHIST
files and create the corresponding datasets. The rb3
package provides functions to seamlessly handle this process.
Downloading yearly data
For comprehensive historical analysis, you can download yearly COTAHIST files. This is ideal for long-term studies covering multiple years.
# Download data for multiple years (example: 2018 to 2024)
fetch_marketdata("b3-cotahist-yearly", year = 2018:2024)
Downloading daily data
For more recent analysis or when you need specific dates, you can fetch daily data:
# Download data for specific dates
fetch_marketdata("b3-cotahist-daily", refdate = as.Date("2024-01-02"))
Accessing the datasets
After downloading the data, you can access it using the
cotahist_get() function:
# Access yearly dataset
ch <- cotahist_get("yearly")

# Access daily dataset
ch_daily <- cotahist_get("daily")
The cotahist_get() function returns a lazy query that
doesn’t immediately load the data into memory. This approach allows
efficient manipulation of large datasets. To materialize the data as an
R tibble, use the collect() function.
Filtering by asset type
The COTAHIST files contain data for various types of assets. The
rb3 package provides specialized filter functions to
extract specific asset classes:
Equities
For stocks trading on B3:
# Filter for stocks from 2024
eq <- ch |>
  filter(year(refdate) == 2024) |>
  cotahist_filter_equity()
ETFs (Exchange Traded Funds)
For ETFs listed on B3:
# Filter for ETFs from 2024
etfs <- ch |>
  filter(year(refdate) == 2024) |>
  cotahist_filter_etf()
REITs (FIIs - Fundos Imobiliários)
For real estate investment funds:
# Filter for REITs from 2024
fii <- ch |>
  filter(year(refdate) == 2024) |>
  cotahist_filter_fii()
BDRs (Brazilian Depositary Receipts)
For Brazilian depositary receipts of international companies:
# Filter for BDRs
bdrs <- cotahist_get() |>
  cotahist_filter_bdr()
Other asset classes
Additional filter functions are available for other asset types:
-
cotahist_filter_unit(): For UNITs (sets of securities traded as a single unit) -
cotahist_filter_fidc(): For FIDCs (Credit Rights Investment Funds) -
cotahist_filter_fiagro(): For FIAGROs (Agribusiness Investment Funds) -
cotahist_filter_index(): For market indices -
cotahist_filter_equity_options(): For stock options -
cotahist_filter_index_options(): For index options -
cotahist_filter_fund_options(): For fund options
Analyzing equity data
Let’s explore some common analyses you might perform with this historical data.
Top traded equities by volume
This example identifies the most actively traded stocks and visualizes their monthly trading volumes:
# Get top 10 stocks by volume
symbols_eq <- eq |>
  group_by(symbol) |>
  summarise(volume = sum(volume)) |>
  arrange(desc(volume)) |>
  head(10) |>
  pull(symbol, as_vector = TRUE)

# Calculate monthly volumes for top stocks
eq_monthly <- eq |>
  filter(symbol %in% symbols_eq) |>
  mutate(month = floor_date(refdate, "month")) |>
  group_by(month, symbol) |>
  summarise(volume = sum(volume)) |>
  collect()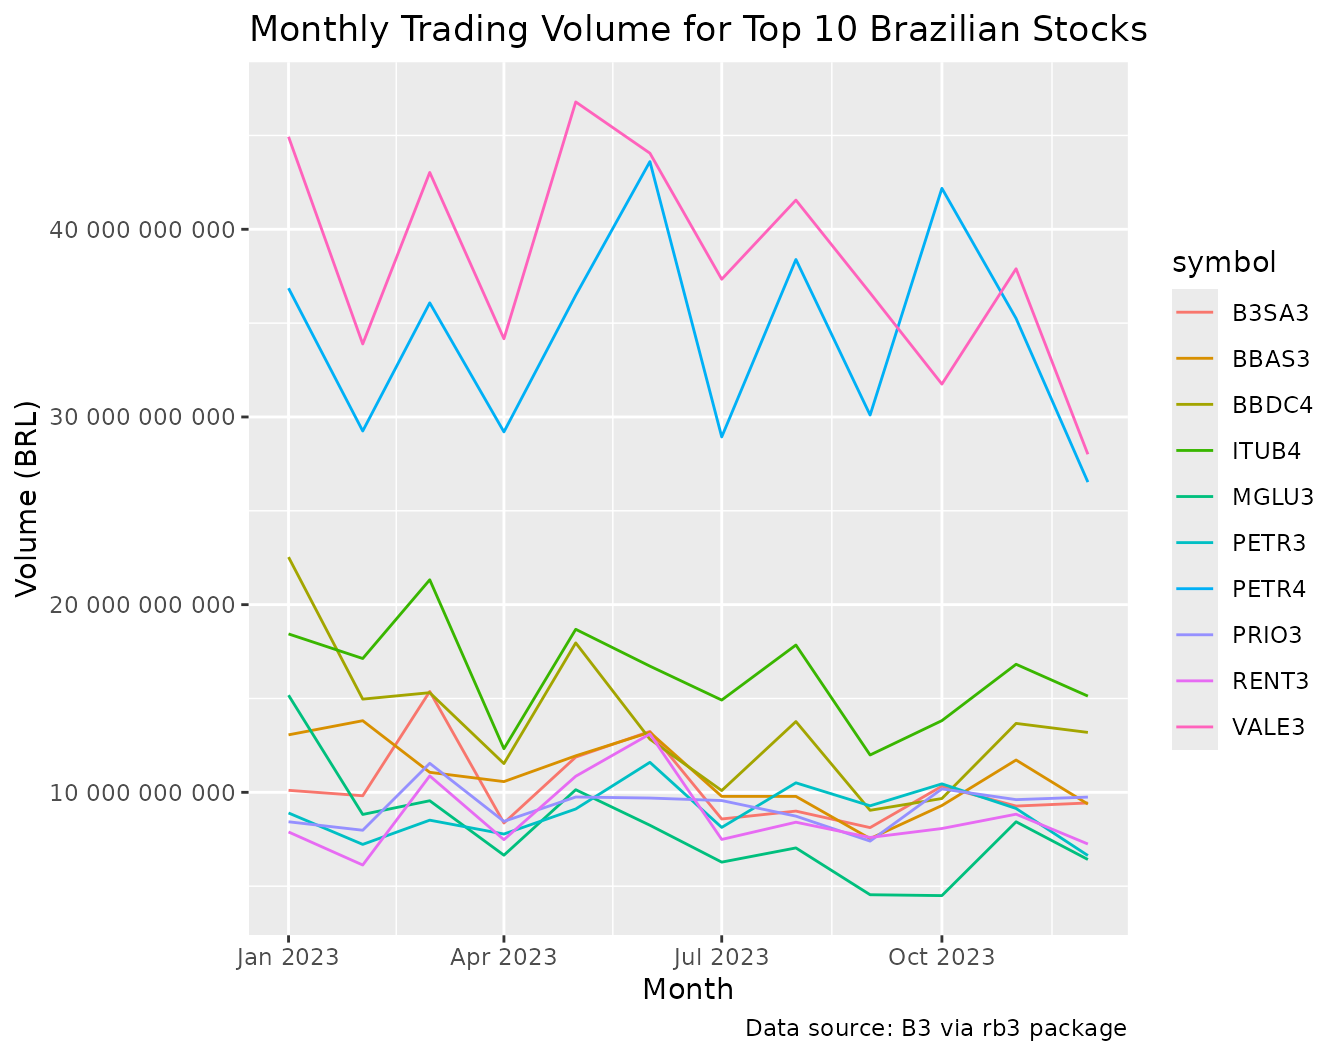
Monthly Trading Volume for Top 10 Brazilian Stocks
ETF market share analysis
The market share of different ETFs provides insights into investor preferences:
# Calculate total ETF volume
total_volume <- etfs |>
  summarise(volume = sum(volume)) |>
  pull(volume, as_vector = TRUE)

# Get volume share for top ETFs
etf_shares <- etfs |>
  group_by(symbol) |>
  summarise(volume = sum(volume)) |>
  collect() |>
  mutate(volume_ratio = volume / total_volume) |>
  slice_max(volume_ratio, n = 10) |>
  mutate(volume_ratio_acc = cumsum(volume_ratio))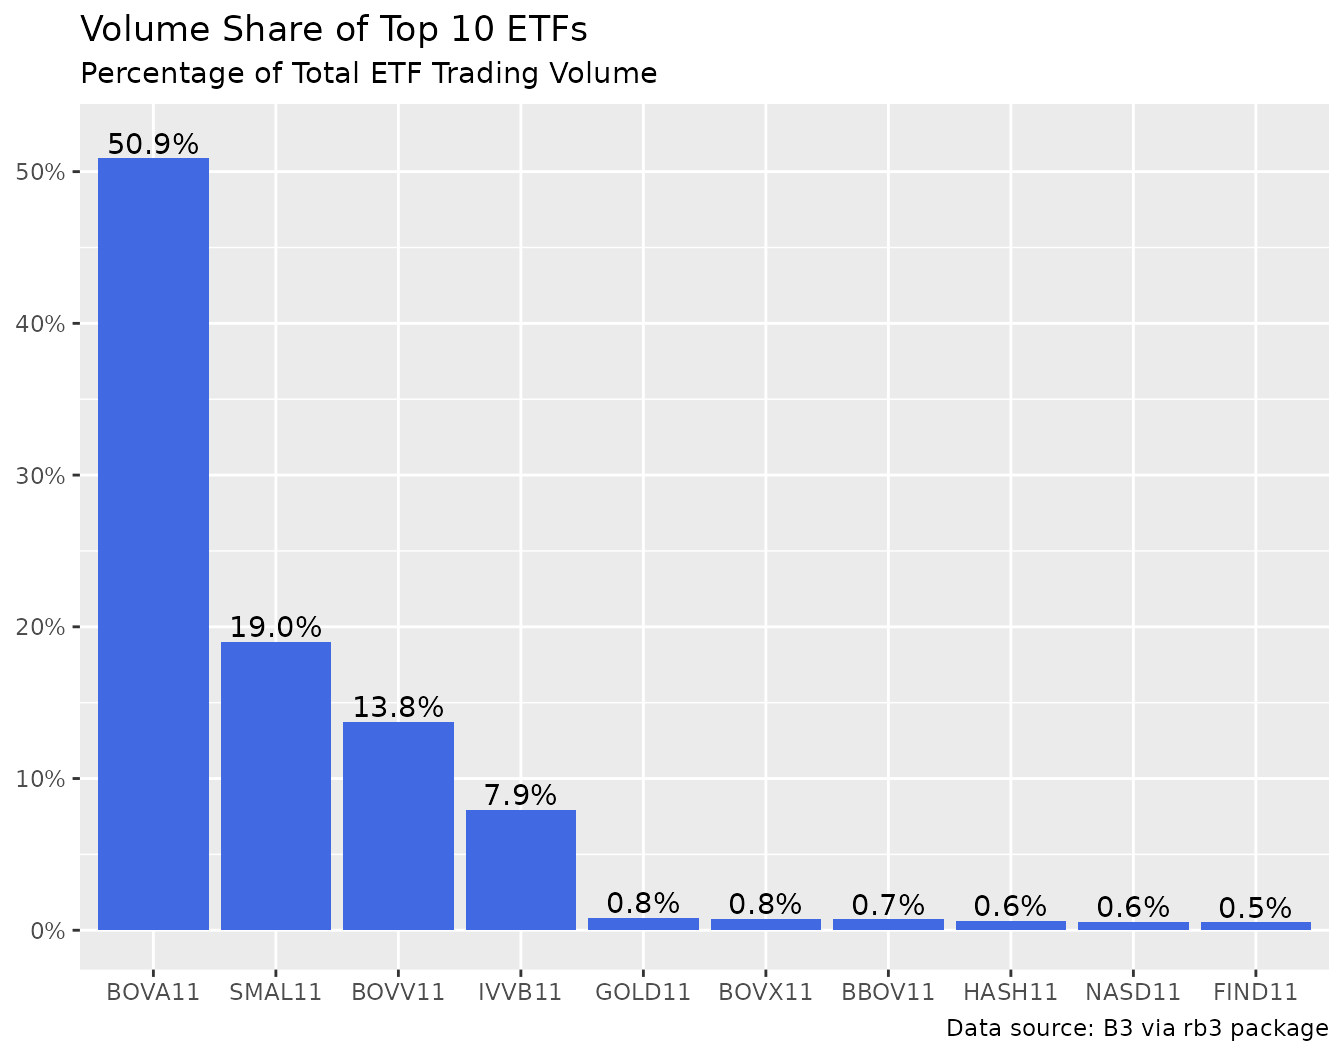
Volume Share of Top 10 ETFs
Analyzing distribution IDs for price continuity
The distribution_id field helps identify changes in a
stock’s pricing series, which might be due to corporate actions:
# Select a specific stock
symbol_ <- "ITUB4"

# Extract data for the selected stock
stock_data <- equities |>
  filter(symbol == symbol_) |>
  arrange(refdate) |>
  collect()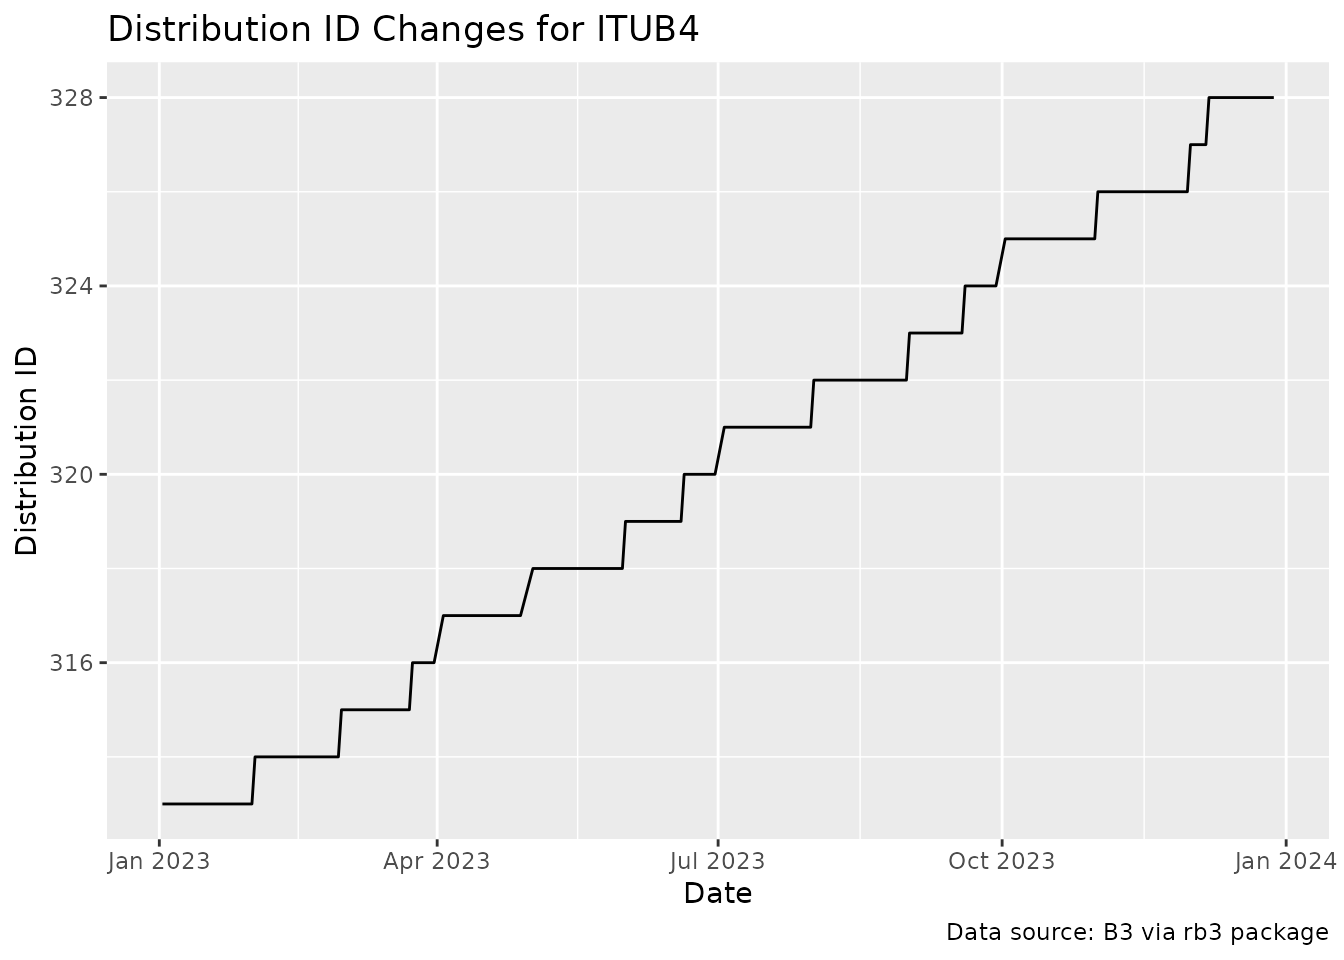
Distribution ID Changes for ITUB4
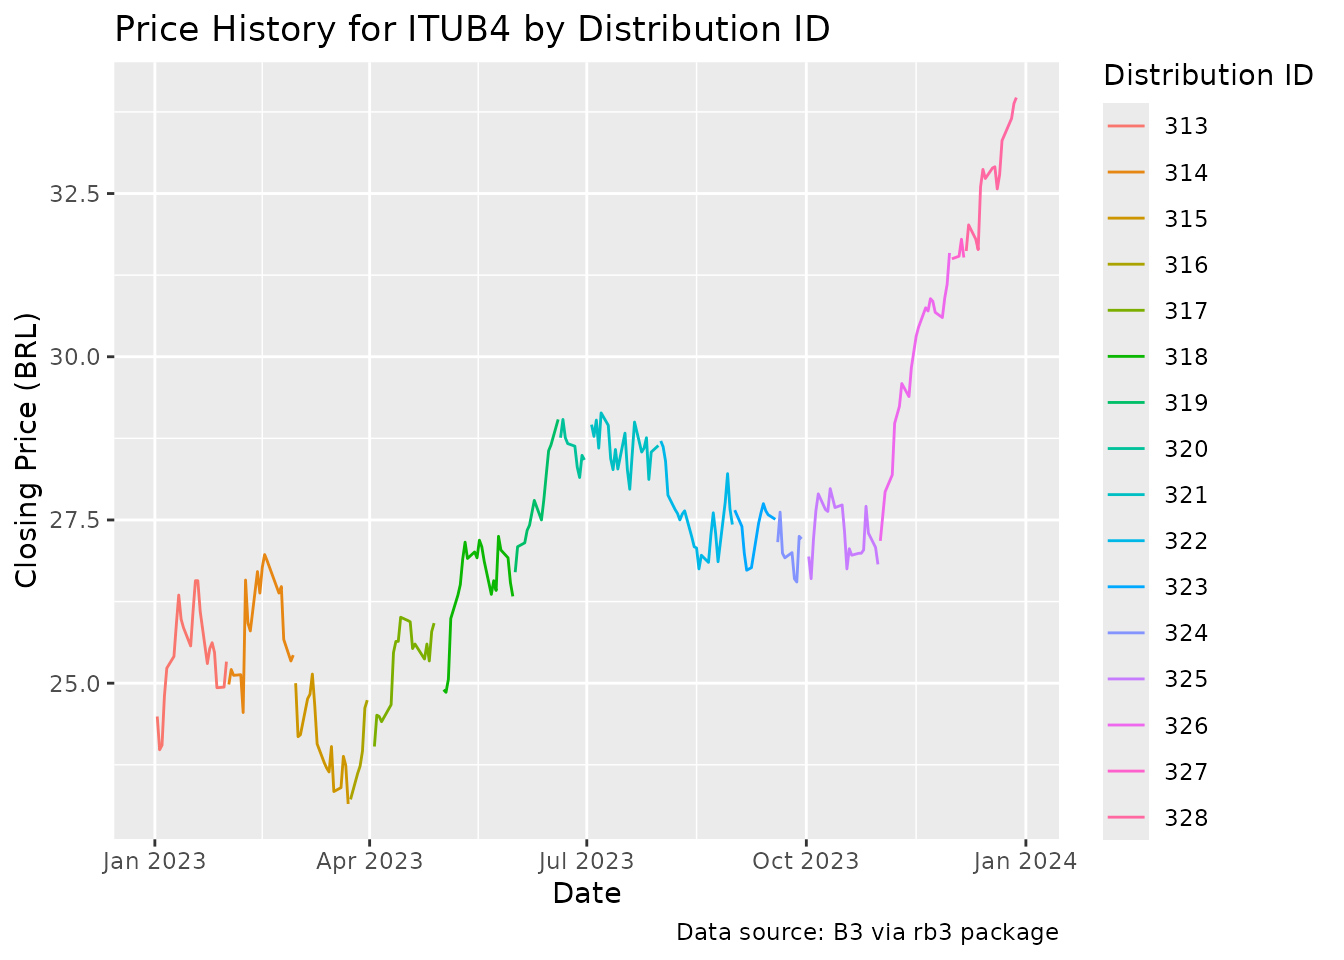
Price History for ITUB4 by Distribution ID
Working with BDRs
Brazilian Depositary Receipts (BDRs) represent shares of companies listed on foreign exchanges:
# Find the most common BDRs in the dataset
top_bdrs <- bdrs |>
  group_by(symbol) |>
  count(sort = TRUE) |>
  head(15) |>
  collect()

# Analyze trading volume for a specific BDR
bdr_data <- bdrs |>
  filter(symbol == "AAPL34") |>
  arrange(refdate) |>
  collect()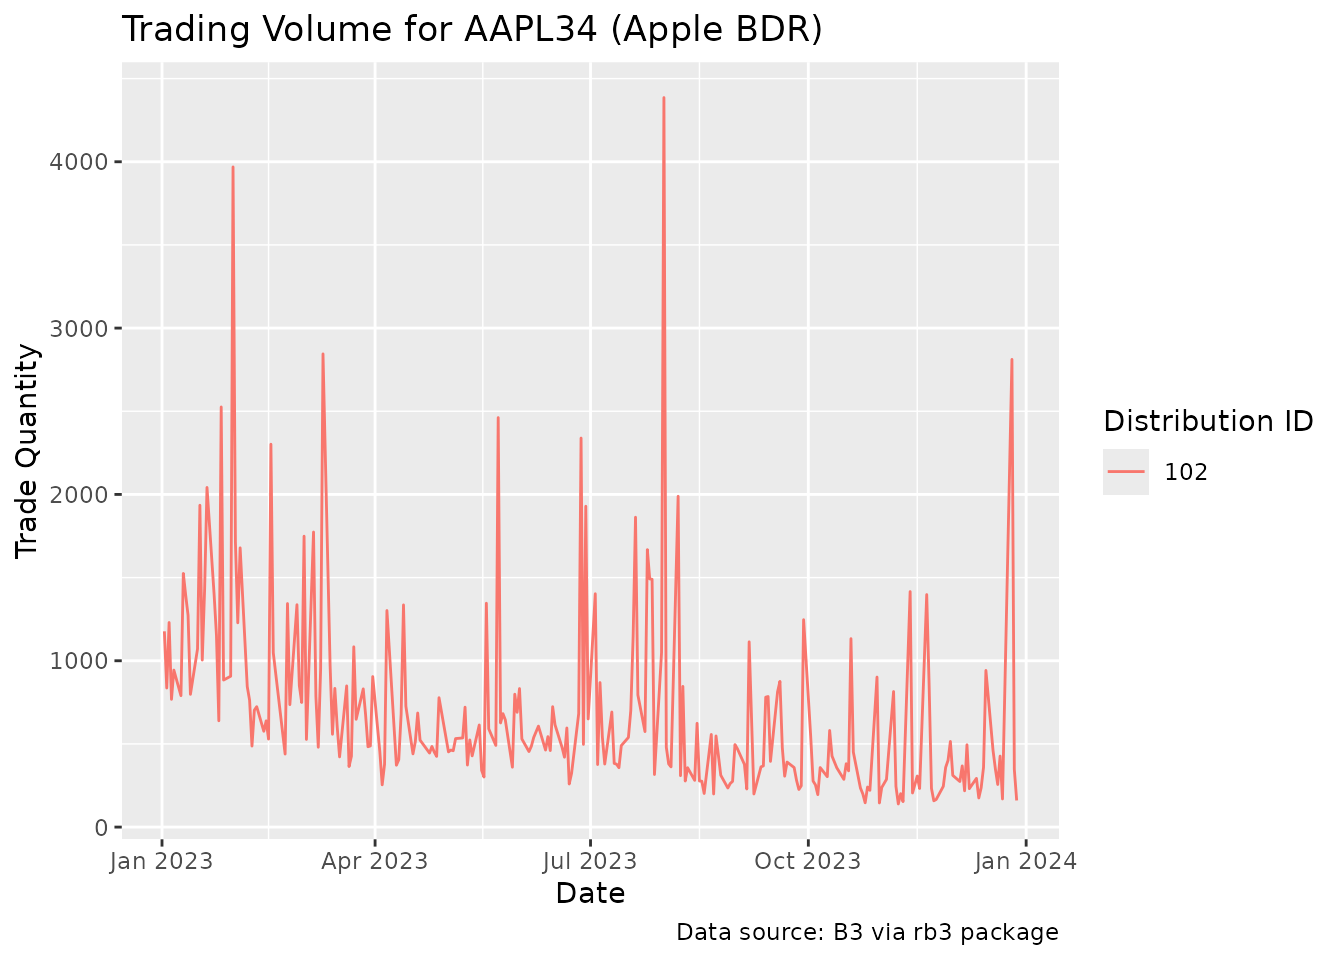
Trading Volume for AAPL34 (Apple BDR)
Conclusion
In this vignette, we’ve explored how to fetch and analyze historical
equity data from B3 using the rb3 package. The package
provides efficient tools for downloading COTAHIST files and extracting
specific asset classes through specialized filter functions.
The key steps in working with historical equity data include:
-
Downloading data using
fetch_marketdata()with either theb3-cotahist-yearlyorb3-cotahist-dailytemplates -
Accessing datasets with
cotahist_get() -
Filtering by asset type using specialized functions
like
cotahist_filter_equity(),cotahist_filter_etf(), etc. - Analyzing the data using standard R data manipulation and visualization tools
This workflow enables a wide range of analyses, from studying trading volumes and market shares to tracking price movements and identifying corporate actions through distribution IDs.
For more advanced analyses, you might consider:
- Adjusting prices for corporate actions
- Building portfolios and calculating returns
- Analyzing liquidity patterns
- Studying sector performance
- Constructing custom indices
The combination of B3’s comprehensive historical data and the
rb3 package’s user-friendly interface provides a powerful
toolkit for researching and analyzing the Brazilian equity market.