Produce a waffle chart of the parameters collected in a site LTER.
Source:R/produce_site_parameters_waffle.R
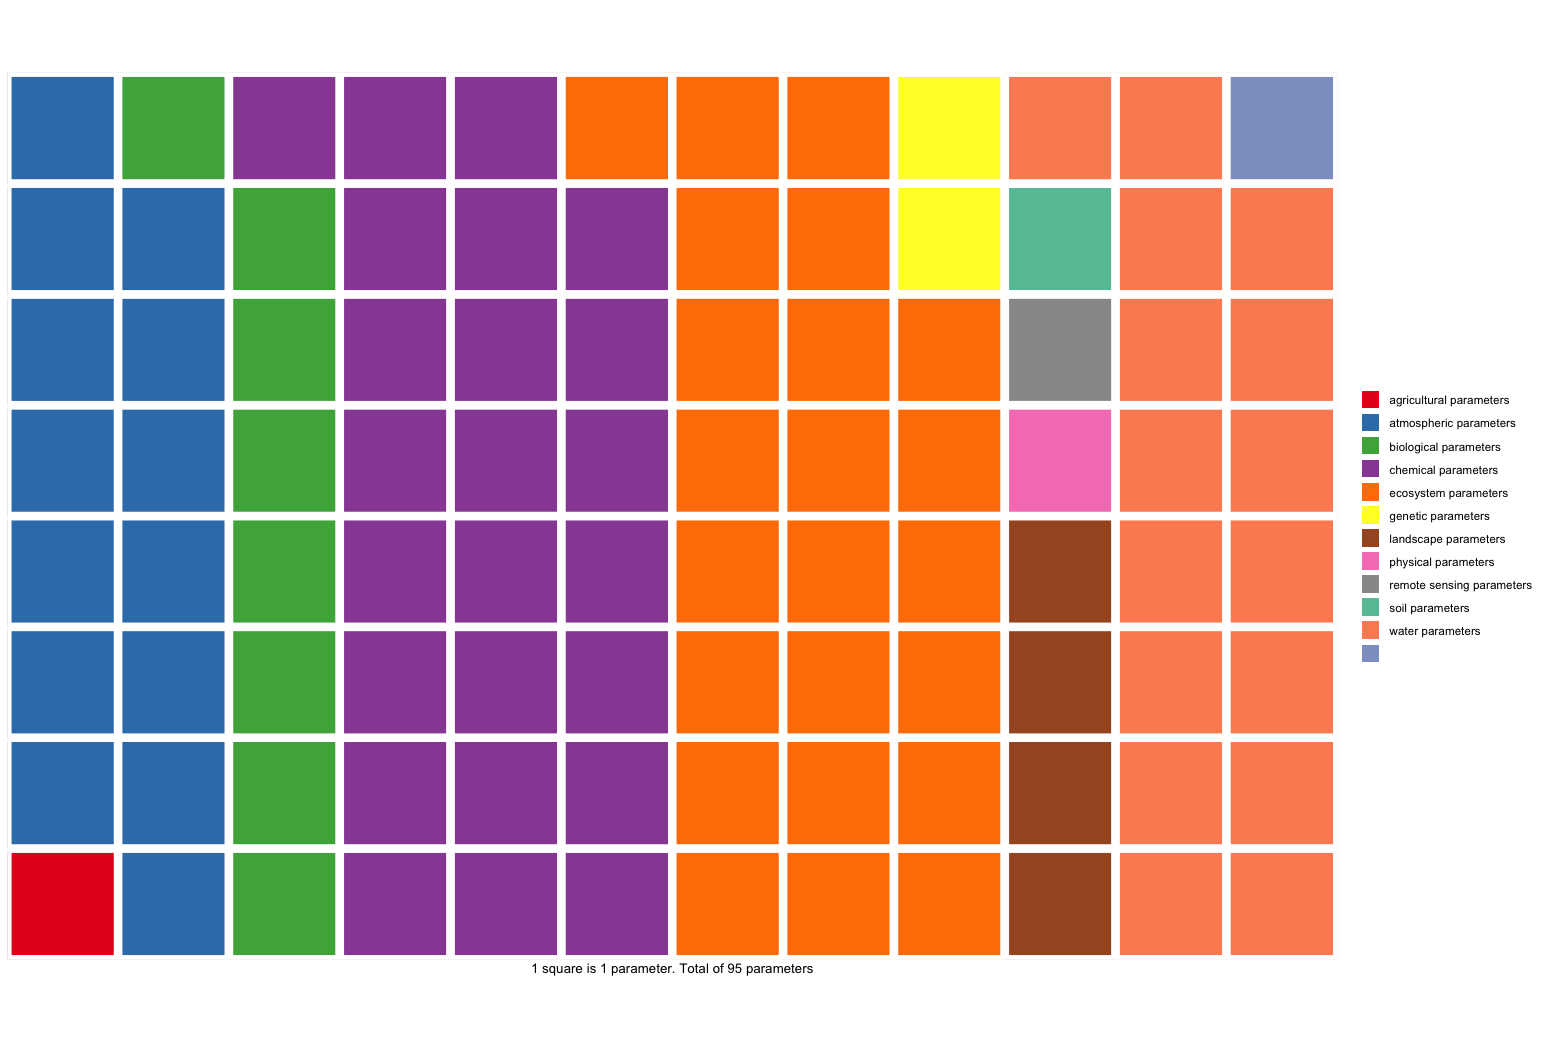
produce_site_parameters_waffle.RdReturn a waffle chart of Environmental Parameters, as a stored in DEIMS-SDR catalogue, of a single eLTER site.
Arguments
- deimsid
A
character. The DEIMS ID of site/network from: DEIMS-SDR website. DEIMS ID information here.
Value
The output of the function is a waffle chart and a tibble. Each
of the squares represents a parameters measured into the selected eLTER
site. The parameters with the same color belong to the same group (e.g.
biological, atmospheric, etc.).
References
Müller K, Wickham H (2022). tibble: Simple Data Frames. R package version 3.1.7, https://CRAN.R-project.org/package=tibble.
Wickham H, François R, Henry L, Müller K (2022). dplyr: A Grammar of Data Manipulation. R package version 1.0.9, https://CRAN.R-project.org/package=dplyr.
R Core Team (2021). R: A Language and Environment for Statistical Computing. R Foundation for Statistical Computing, Vienna, Austria. https://www.R-project.org/.
Neuwirth E (2022). RColorBrewer: ColorBrewer Palettes. R package version 1.1-3, https://CRAN.R-project.org/package=RColorBrewer.
Rudis B, Gandy D (2017). waffle: Create Waffle Chart Visualizations in R. R package version 0.7.0, https://CRAN.R-project.org/package=waffle.
Author
Alessandro Oggioni, phD (2020) oggioni.a@irea.cnr.it