Adds percentile reference bands from a cohort to an individual's metric plot.
Arguments
- p
A ggplot object (typically from plot_acwr or similar).
- reference_data
A data frame from
calculate_cohort_reference().- bands
Character vector specifying which bands to plot. Options: "p25_p75" (inner quartiles), "p05_p95" (outer 5-95 range), "p50" (median). Default c("p25_p75", "p05_p95", "p50").
- alpha
Transparency for reference bands (0-1). Default 0.15.
- colors
Named list of colors for bands. Default uses Nature-inspired palette colors.
Examples
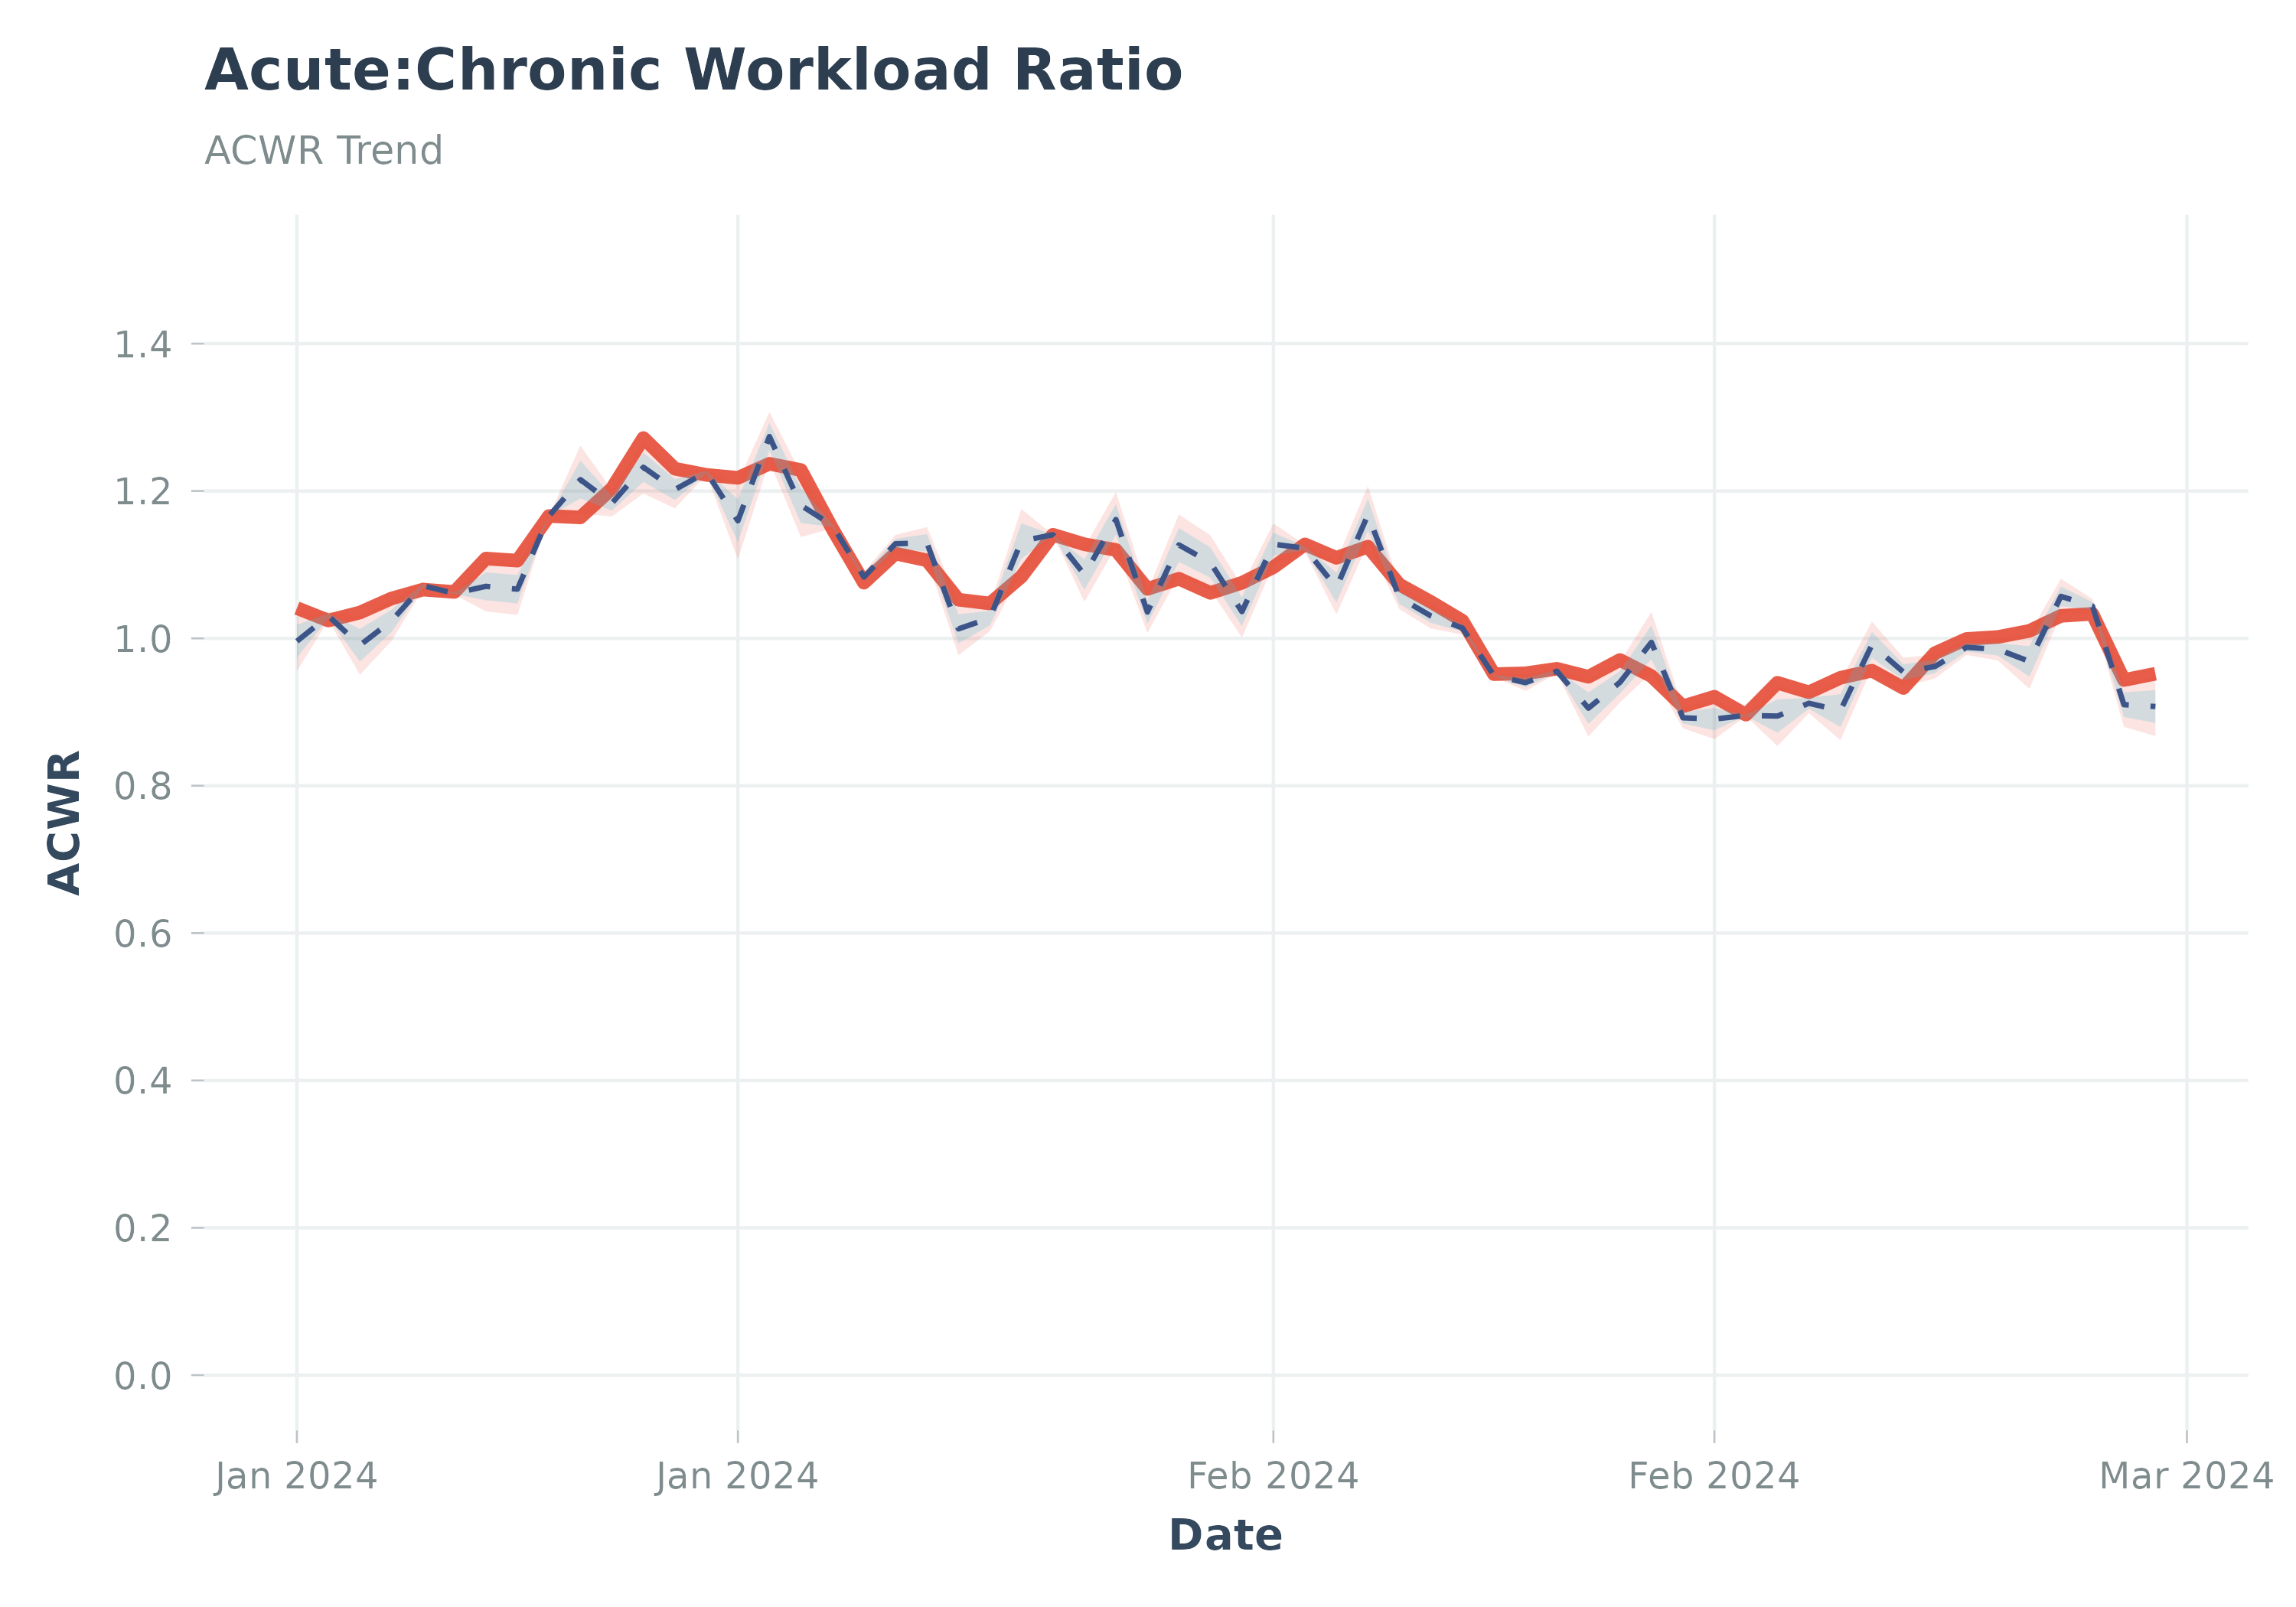
# Example: add reference bands to an ACWR plot
data("sample_acwr", package = "Athlytics")
set.seed(42)
cohort <- dplyr::bind_rows(
  dplyr::mutate(sample_acwr, athlete_id = "A1"),
  dplyr::mutate(sample_acwr, athlete_id = "A2",
    acwr_smooth = acwr_smooth * runif(nrow(sample_acwr), 0.9, 1.1))
)
ref <- suppressWarnings(
  calculate_cohort_reference(cohort, metric = "acwr_smooth", min_athletes = 2)
)
p <- suppressMessages(plot_acwr(sample_acwr, highlight_zones = FALSE))
p_ref <- add_reference_bands(p, reference_data = ref)
print(p_ref)