Using hydroscoper’s data
Konstantinos Vantas
2026-07-20
Source:vignettes/stations_with_data.Rmd
stations_with_data.RmdThis vignette shows how to use the package’s internal data sets.
Data sets
There are three data sets stored in the package.
stations is comprised of the stations’ id, name, longitude,
latitude, etc.
stations
#> # A tibble: 2,322 × 9
#>    station_id name  water_basin water_division owner longitude latitude altitude
#>         <int> <chr> <chr>       <chr>          <chr>     <dbl>    <dbl>    <dbl>
#>  1     501032 AG. … "KOURTALIO… GR13           min_…      NA       NA        NA
#>  2     200246 GEPH… "ALPHEIOS … GR01           min_…      22.0     37.5     318
#>  3     200237 TROP… "ALPHEIOS … GR01           min_…      22.0     37.7     728.
#>  4     200231 BYTI… "ALPHEIOS … GR01           min_…      22.2     37.7    1011.
#>  5     200200 LYKO… "ALPHEIOS … GR01           min_…      22.2     37.9     758.
#>  6     200236 MEGA… "ALPHEIOS … GR01           min_…      22.1     37.4     429.
#>  7     200244 ODOG… "REMA CHOR… GR01           min_…      21.8     37.0     182.
#>  8     200204 TRIP… "ALPHEIOS … GR01           min_…      21.9     37.9     570.
#>  9     200198 KAST… "ALPHEIOS … GR01           min_…      22.0     37.9     792.
#> 10     200239 PERD… "ALPHEIOS … GR01           min_…      22.0     37.7     837.
#> # ℹ 2,312 more rows
#> # ℹ 1 more variable: subdomain <chr>
timeseries of the time series’ id, the corresponding
station, variable type, time step etc.
timeseries
#> # A tibble: 10,804 × 8
#>    time_id station_id variable      timestep units start_date end_date subdomain
#>      <int>      <int> <chr>         <chr>    <chr> <chr>      <chr>    <chr>
#>  1    2248     501049 temperature_… NA       °     2009-02-0… 2010-08… kyy
#>  2     430     200103 wind_directi… NA       °     1950-10-2… 1997-07… kyy
#>  3     905     200247 wind_directi… NA       °     1967-01-0… 1997-12… kyy
#>  4    2243     501058 temperature_… NA       °     1999-01-0… 2010-08… kyy
#>  5     438     200105 wind_directi… NA       °     1950-06-0… 1997-07… kyy
#>  6     553     200135 wind_directi… NA       °     1964-11-2… 1997-08… kyy
#>  7     966     200265 wind_directi… NA       °     1967-01-0… 1997-03… kyy
#>  8     775     200203 wind_directi… NA       °     1964-05-2… 1997-06… kyy
#>  9    2245     501046 temperature_… NA       °     2007-07-0… 2010-07… kyy
#> 10     247     200034 wind_directi… NA       °     1969-11-2… 1997-09… kyy
#> # ℹ 10,794 more rows
greece_borders is a data-frame for use with the function
geom_polygon from the ggplot2 package.
Stations location
stations and greece_borders can be used to
create a map with all Hydroscope’s stations. Unfortunately, there is a
number of them that have erroneous coordinates (over the sea and far
from Greece). Also, there are 120 stations with missing coordinates.
ggplot() +
  geom_polygon(data = greece_borders,
               aes(long, lat, group = group),
               fill = "grey",
               color = NA) +
  geom_point(data = stations,
             aes(x = longitude, y = latitude, color = subdomain)) +
  scale_color_manual(values=c("#E64B35FF", "#4DBBD5FF", "#00A087FF",
                              "#3C5488FF"))+
  coord_fixed(ratio=1) +
  theme_bw()
#> Warning: Removed 120 rows containing missing values or values outside the scale range
#> (`geom_point()`).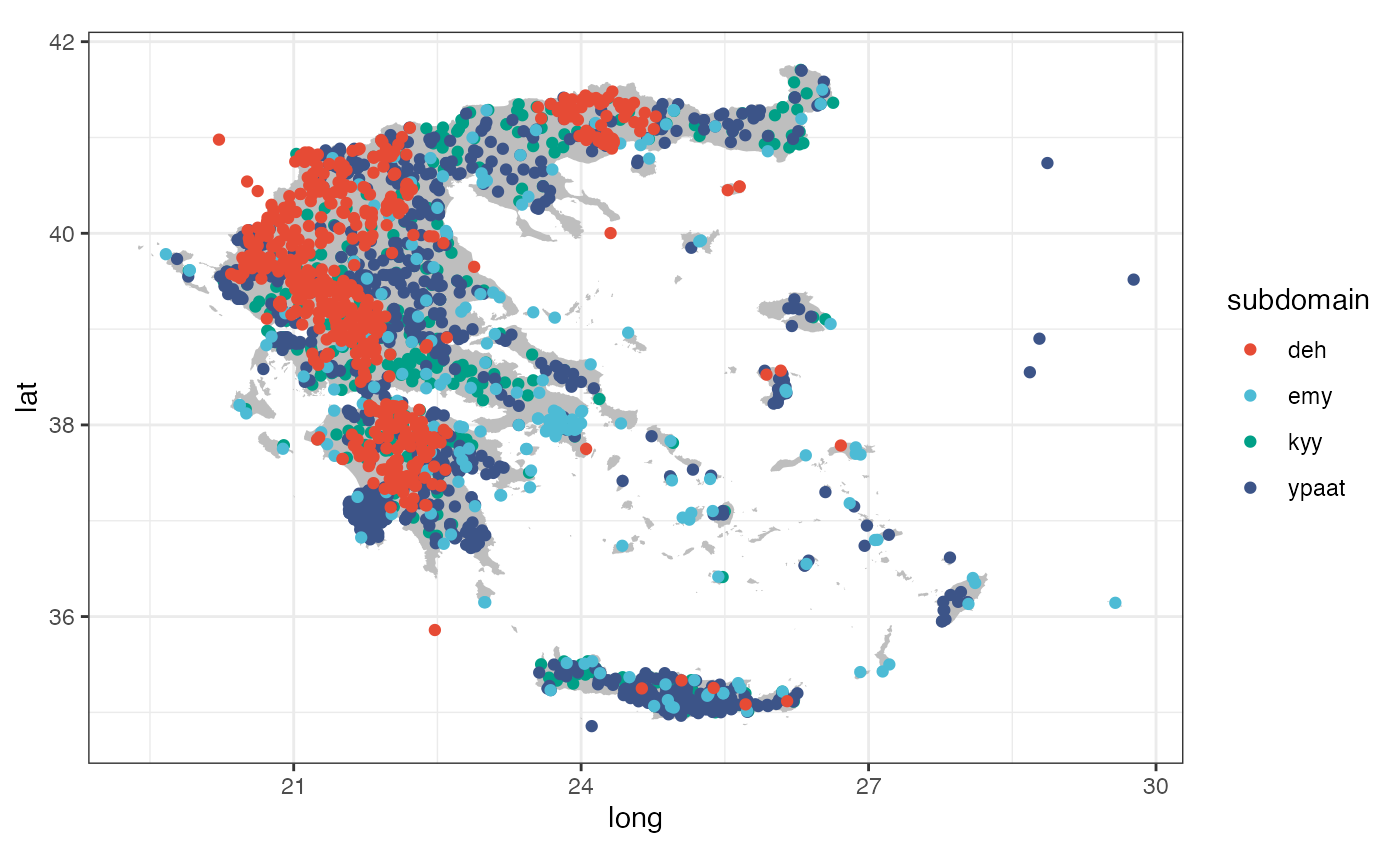
Stations with available time series
The location of the stations with time series available to download are presented at the following map.
stations_ts <- subset(stations, station_id %in% timeseries$station_id &
                        subdomain %in% c("kyy", "ypaat"))


ggplot() +
  geom_polygon(data = greece_borders,
               aes(long, lat, group = group),
               fill = "grey",
               color = NA) +
  geom_point(data = stations_ts,
             aes(x = longitude, y = latitude, color = subdomain)) +
  scale_color_manual(values=c("#00A087FF", "#3C5488FF"))+
  coord_fixed(ratio=1) +
  theme_bw()
#> Warning: Removed 10 rows containing missing values or values outside the scale range
#> (`geom_point()`).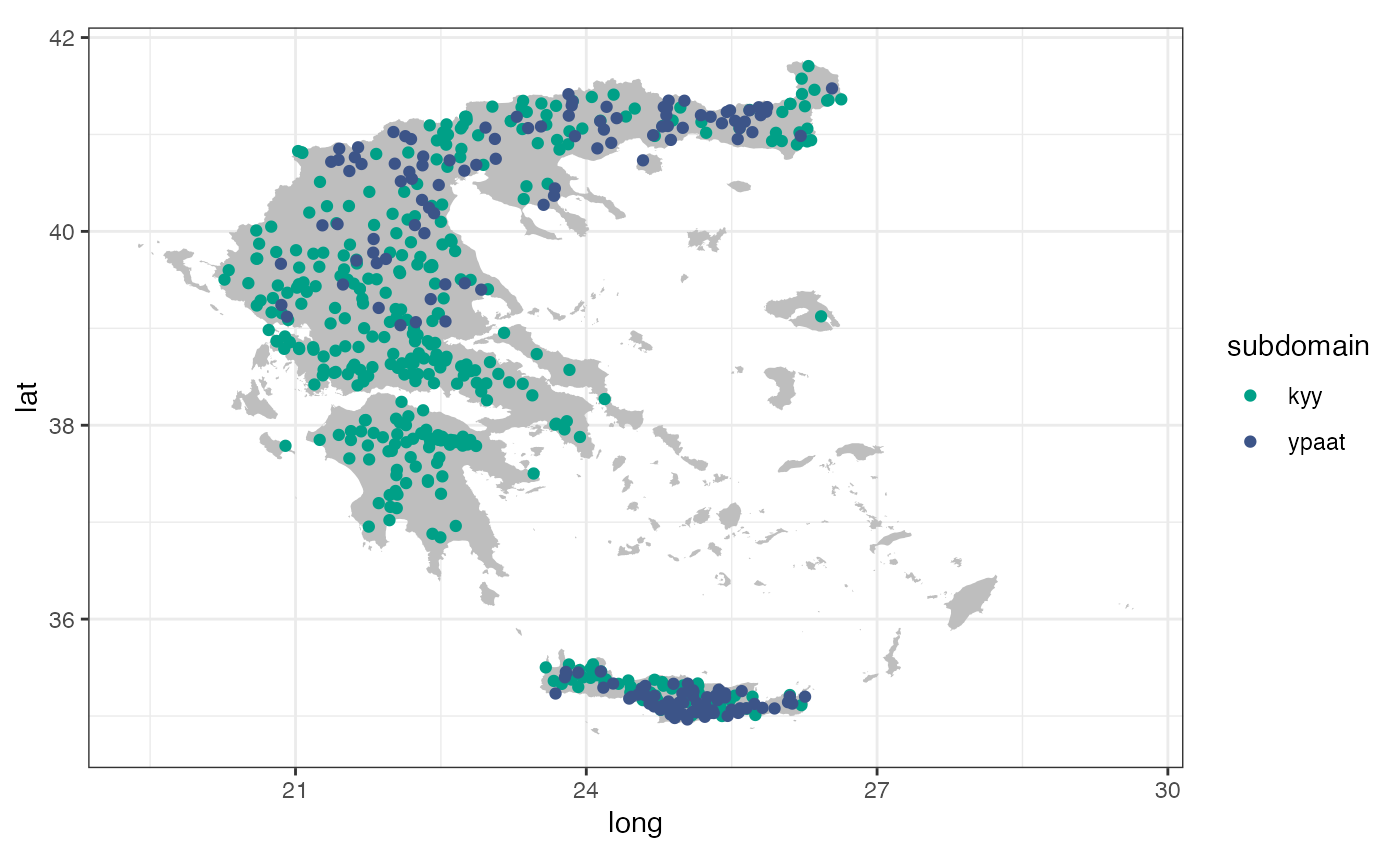
Although there is a large number of stations with available data, there is heterogeneity in the coverage of the country.