spectrum_blur_ratio() measures blur ratio of frequency spectra
from sounds referenced in an extended selection table. It is
analogous to blur_ratio(), but operates in the frequency domain
rather than the time domain.
Usage
spectrum_blur_ratio(
  X,
  cores = getOption("mc.cores", 1),
  pb = getOption("pb", TRUE),
  spec.smooth = getOption("spec.smooth", 5),
  spectra = FALSE,
  res = 150,
  hop.size = getOption("hop.size", 11.6),
  wl = getOption("wl", NULL),
  ovlp = getOption("ovlp", 70),
  path = getOption("sound.files.path", "."),
  n.bins = 100
)
Arguments
- X
The output of
set_reference_sounds(), an object of classdata.frame,selection_table, orextended_selection_table(the last 2 classes are created bywarbleR::selection_table()from the warbleR package) with the test sound files' annotations. Must contain the following columns: 1)sound.files: name of the.wavfiles, 2)selec: unique selection identifier (within a sound file), 3)start: start time and 4)end: end time of selections, 5)bottom.freq: low frequency for bandpass, 6)top.freq: high frequency for bandpass, 7)sound.id: ID of sounds used to identify counterparts across distances, and 8)reference: identity of sounds to be used as reference for each test sound (row). Seeset_reference_sounds()for more details on the structure ofX.- cores
Numeric vector of length 1. Controls whether parallel computing is applied by specifying the number of cores to be used. Default
1(i.e. no parallel computing). Can be set globally for the current R session via the"mc.cores"option (seeoptions()).- pb
Logical argument to control if progress bar is shown. Default
TRUE. Can be set globally for the current R session via the"pb"option (seeoptions()).- spec.smooth
Numeric vector of length 1 determining the length of the sliding window used for a sum smooth for power spectrum calculation (in kHz). Default
5.- spectra
Logical to control if power spectra are returned (as attributes). Default
FALSE.- res
Numeric argument of length 1. Controls image resolution. Default
150(faster), although 300-400 is recommended for publication/presentation quality.- hop.size
Numeric vector of length 1 specifying the time window duration (in ms). Default
11.6ms, which is equivalent to 512wlfor a 44.1 kHz sampling rate. Ignored ifwlis supplied. Can be set globally for the current R session via the"hop.size"option (seeoptions()).- wl
Numeric vector of length 1 specifying the window length of the spectrogram. Default
NULL. If supplied,hop.sizeis ignored. Applied to both spectra and spectrograms on image files.- ovlp
Numeric vector of length 1 specifying the percentage of overlap between two consecutive windows, as in
seewave::spectro(). Default70. Applied to both spectra and spectrograms on image files. Can be set globally for the current R session via the"ovlp"option (seeoptions()).- path
Character string containing the directory path where the sound files are found. Only needed when
Xis not an extended selection table. If not supplied the current working directory is used. Can be set globally for the current R session via the"sound.files.path"option (seeoptions()).- n.bins
Numeric vector of length 1 specifying the number of frequency bins to use for representing power spectra. Default
100. IfNULL, the raw power spectrum is used (note that this can result in high RAM memory usage for large data sets). Power spectrum values are interpolated usingstats::approx().
Value
Object X with an additional column, spectrum.blur.ratio,
containing the computed spectrum blur ratio values. If
spectra = TRUE, the output would also include power spectra for
all sounds as attributes (attributes(X)$spectra).
Details
Spectral blur ratio measures the degradation of sound as a function
of the change in sound power in the frequency domain, analogous to
the blur ratio proposed by Dabelsteen et al. (1993) for the time
domain (and implemented in blur_ratio()). Low values indicate low
degradation of sounds. The function measures the blur ratio of
spectra from sounds in which a reference playback has been
re-recorded at different distances. Spectral blur ratio is measured
as the mismatch between power spectra (expressed as probability
density functions) of the reference sound and the re-recorded
sound. The function compares each sound type to the corresponding
reference sound. The sound.id column must be used to tell the
function to only compare sounds belonging to the same category (e.g.
song-types). Two methods for setting the experimental design are
provided. All wave objects in the extended selection table must have
the same sampling rate, so the length of spectra is comparable. The
function uses seewave::spec() internally to compute power spectra.
NA is returned if at least one of the power spectra cannot be
computed.
References
Dabelsteen, T., Larsen, O. N., & Pedersen, S. B. (1993). Habitat-induced degradation of sound signals: Quantifying the effects of communication sounds and bird location on blur ratio, excess attenuation, and signal-to-noise ratio in blackbird song. The Journal of the Acoustical Society of America, 93(4), 2206. Araya-Salas, M., Grabarczyk, E. E., Quiroz-Oliva, M., Garcia-Rodriguez, A., & Rico-Guevara, A. (2025). Quantifying degradation in animal acoustic signals with the R package baRulho. Methods in Ecology and Evolution, 00, 1-12. https://doi.org/10.1111/2041-210X.14481
See also
blur_ratio(), the analogous metric in the time domain.
Other quantify degradation:
blur_ratio(),
detection_distance(),
envelope_correlation(),
plot_blur_ratio(),
plot_degradation(),
set_reference_sounds(),
signal_to_noise_ratio(),
spcc(),
spectrum_correlation(),
tail_to_signal_ratio()
Author
Marcelo Araya-Salas (marcelo.araya@ucr.ac.cr)
Examples
{
  # load example data
  data("test_sounds_est")

# add reference to X
X <- set_reference_sounds(X = test_sounds_est)

  # get spetrum blur ratio
  spectrum_blur_ratio(X = X)

  # using method 2
   X <- set_reference_sounds(X = test_sounds_est, method = 2)
  spectrum_blur_ratio(X = X)

  # get power spectra
  sbr <- spectrum_blur_ratio(X = X, spectra = TRUE)

  # \donttest{
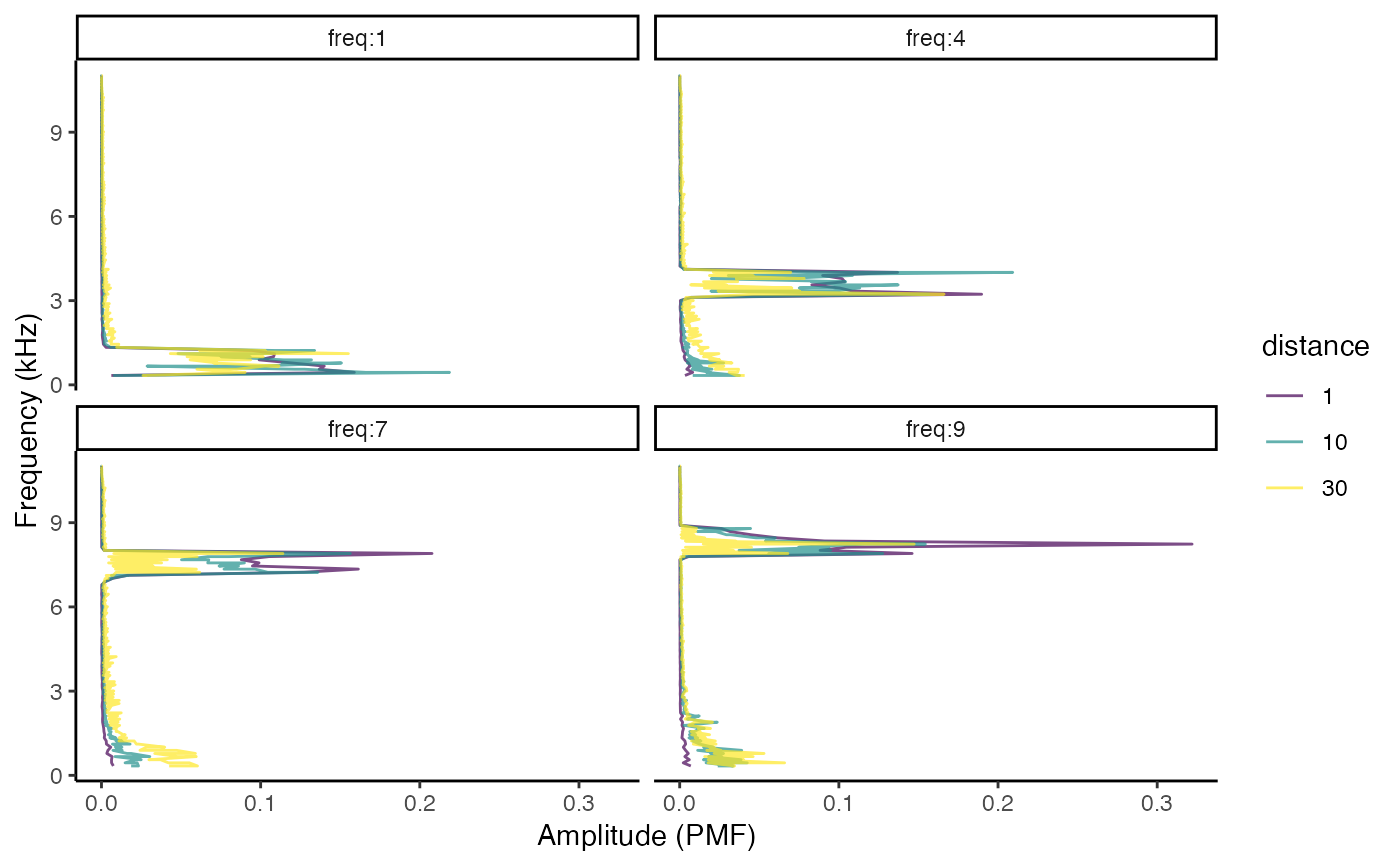
  # plot spectra
  spctr <- attributes(sbr)$spectra

  # make distance a factor for plotting
  spctr$distance <- as.factor(spctr$distance)

  # plot
  rlang::check_installed("ggplot2")
  library(ggplot2)

  ggplot(spctr[spctr$freq > 0.3, ], aes(y = amp, x = freq,
  col = distance)) +
  geom_line() +
  facet_wrap(~sound.id) +
  scale_color_viridis_d(alpha = 0.7) +
  labs(x = "Frequency (kHz)", y = "Amplitude (PMF)") +
  coord_flip() +
  theme_classic()
  # }
}