Enhanced ACWR Plot with Confidence Bands and Reference
Source:R/plot_acwr_enhanced.R
plot_acwr_enhanced.RdCreates a comprehensive ACWR visualization with optional confidence bands and cohort reference percentiles.
Usage
plot_acwr_enhanced(
acwr_data,
reference_data = NULL,
show_ci = TRUE,
show_reference = TRUE,
reference_bands = c("p25_p75", "p05_p95", "p50"),
highlight_zones = TRUE,
title = NULL,
subtitle = NULL,
method_label = NULL,
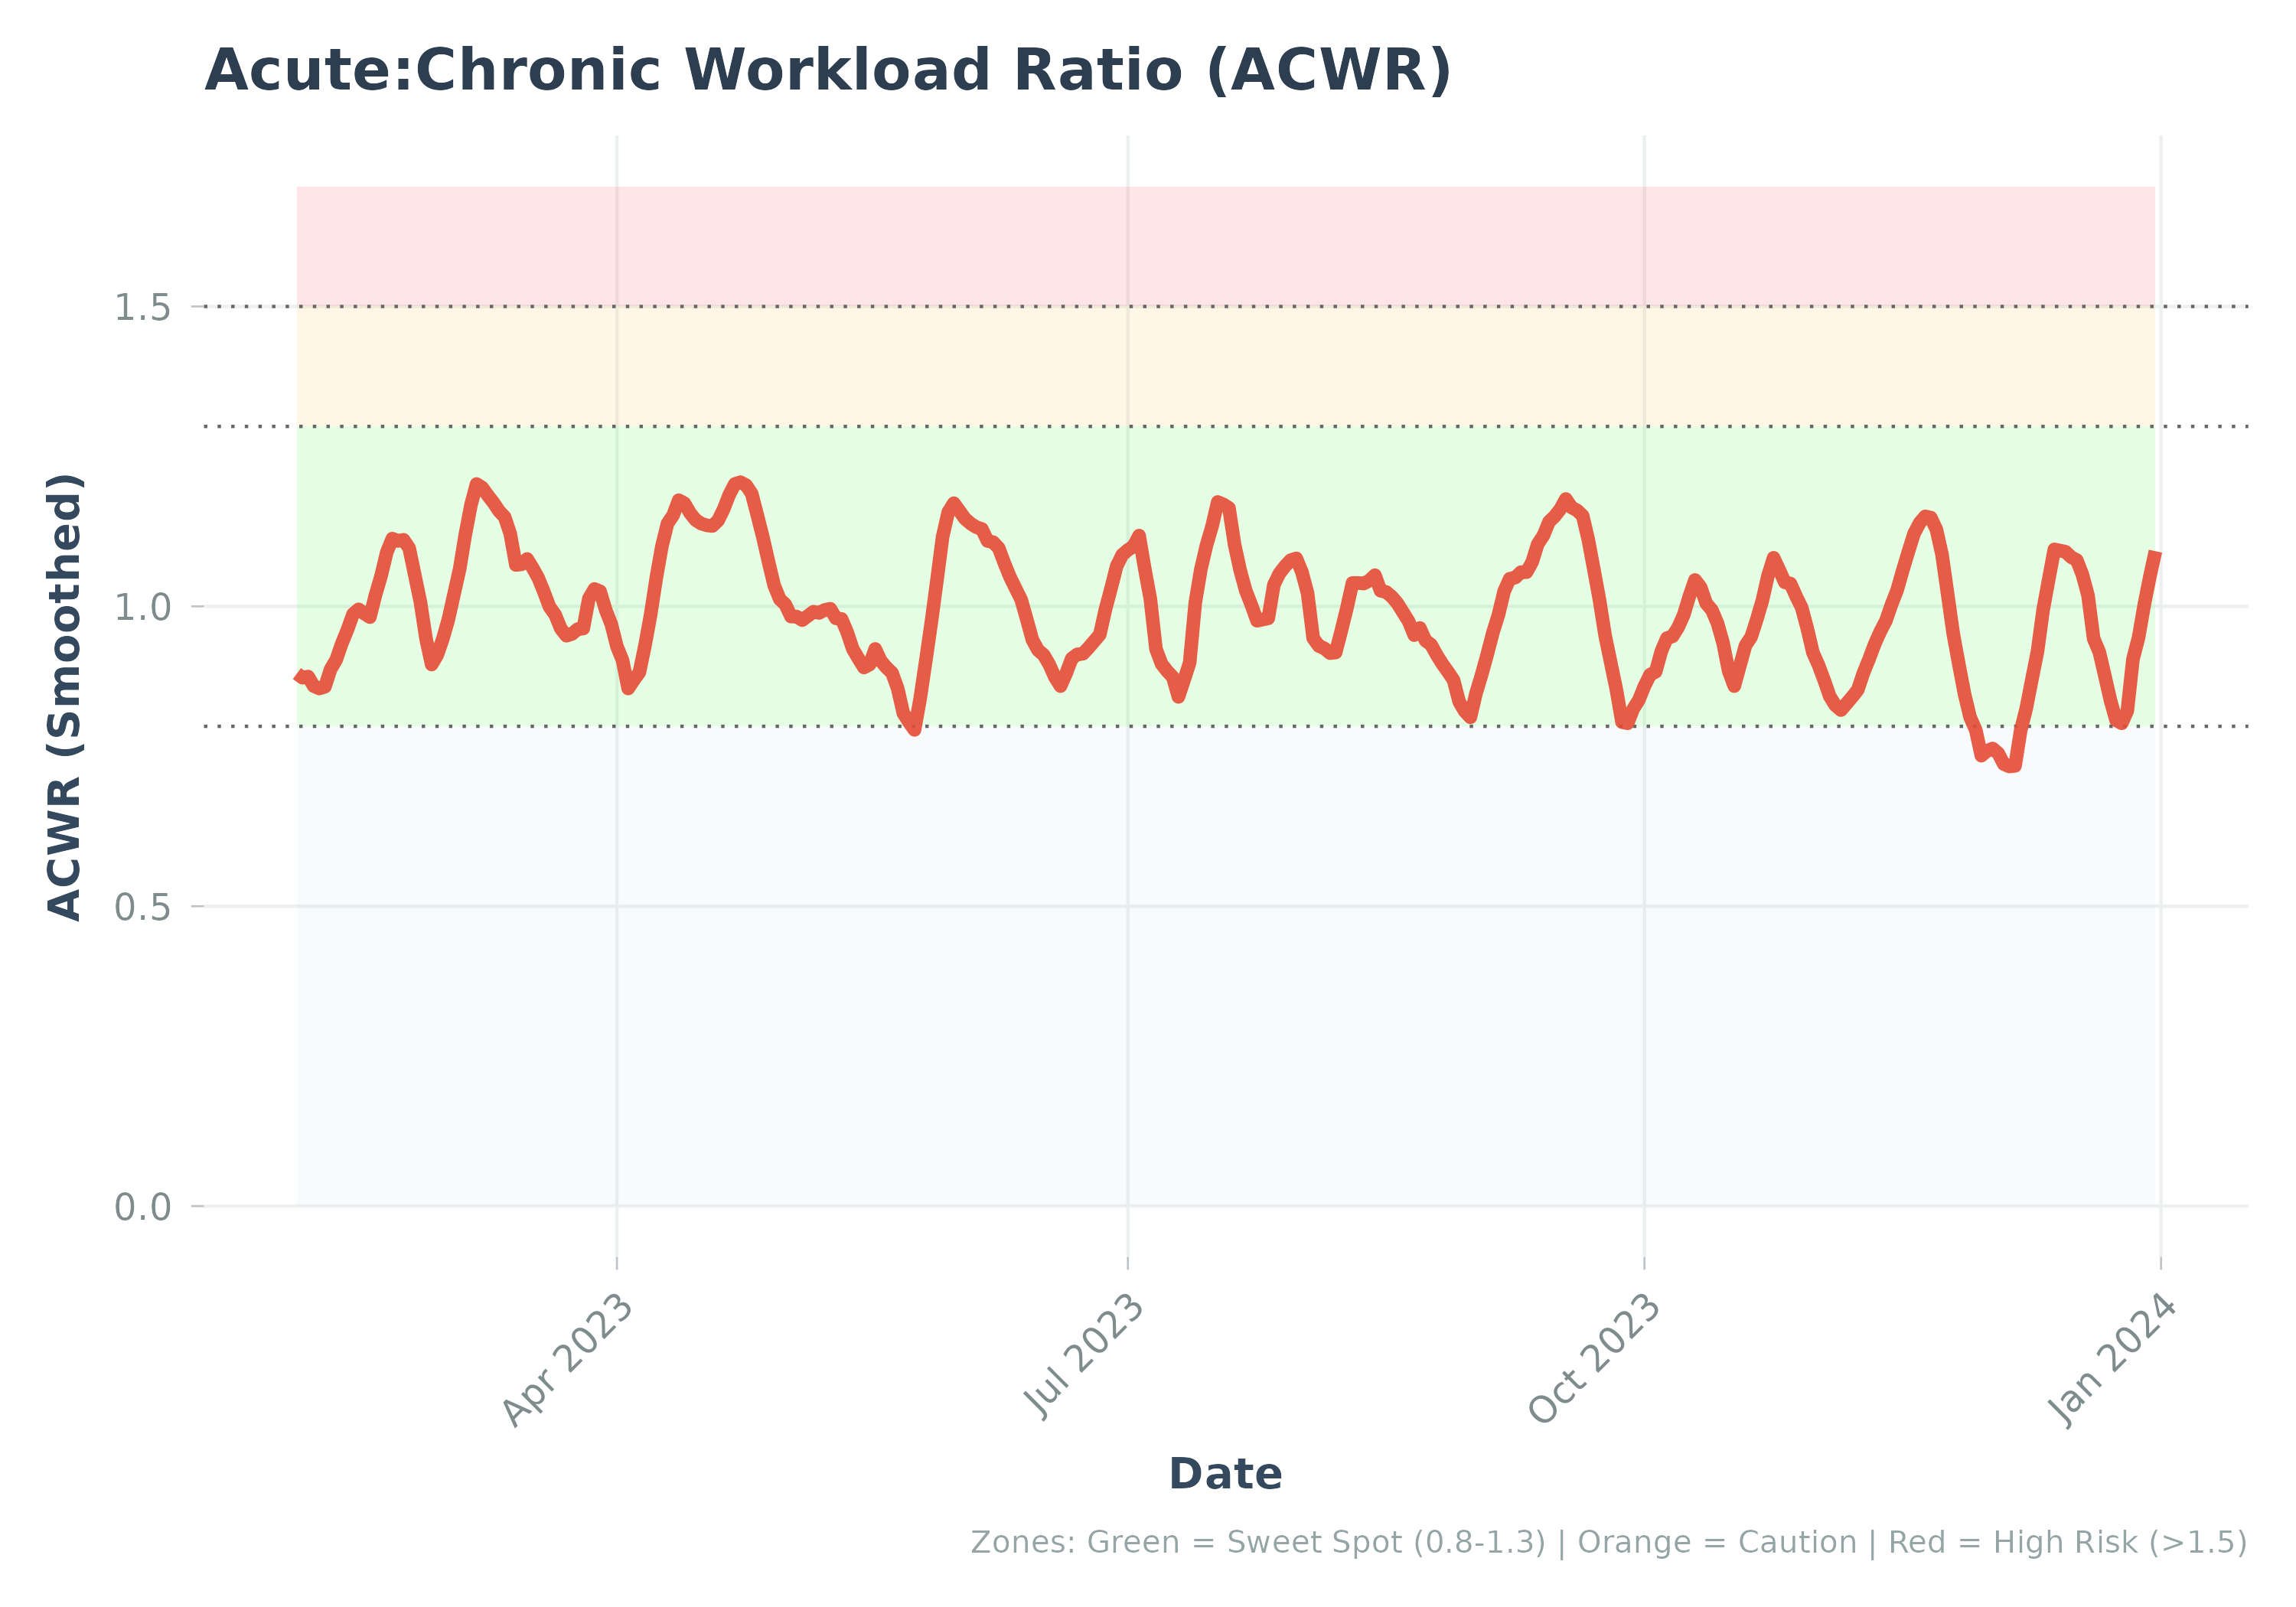
caption = if (highlight_zones) {
"Zones: Green = Sweet Spot (0.8-1.3) | Orange = Caution | Red = High Risk (>1.5)"
}
else {
NULL
}
)Arguments
- acwr_data
A data frame from
calculate_acwr_ewma()containing ACWR values.- reference_data
Optional. A data frame from
calculate_cohort_reference()for adding cohort reference bands.- show_ci
Logical. Whether to show confidence bands (if available in data). Default TRUE.
- show_reference
Logical. Whether to show cohort reference bands (if provided). Default TRUE.
- reference_bands
Which reference bands to show. Default c("p25_p75", "p05_p95", "p50").
- highlight_zones
Logical. Whether to highlight ACWR risk zones. Default TRUE.
- title
Plot title. Default NULL (auto-generated).
- subtitle
Plot subtitle. Default NULL (auto-generated).
- method_label
Optional label for the method used (e.g., "RA", "EWMA"). Default NULL.
- caption
Plot caption. Set to NULL to remove. Defaults to zone description when
highlight_zones = TRUE.
Details
This enhanced plot function combines multiple visualization layers:
Risk zone shading (sweet spot: 0.8-1.3, caution: 1.3-1.5, high risk: >1.5)
Cohort reference percentile bands (if provided)
Bootstrap confidence bands (if available in data)
Individual ACWR trend line
The layering order (bottom to top):
Risk zones (background)
Cohort reference bands (P5-P95, then P25-P75)
Confidence intervals (individual uncertainty)
ACWR line (individual trend)
Note: The predictive value of ACWR for injury risk is debated in the
literature (Impellizzeri et al., 2020). Risk zone labels should be interpreted
as descriptive heuristics, not validated injury predictors. See
calculate_acwr() documentation for full references.
Examples
# Example using sample data
data("sample_acwr", package = "Athlytics")
if (!is.null(sample_acwr) && nrow(sample_acwr) > 0) {
  p <- plot_acwr_enhanced(sample_acwr, show_ci = FALSE)
  print(p)
}


if (FALSE) { # \dontrun{
# Load activities
activities <- load_local_activities("export.zip")

# Calculate ACWR with EWMA and confidence bands
acwr <- calculate_acwr_ewma(
  activities,
  method = "ewma",
  ci = TRUE,
  B = 200
)

# Basic enhanced plot
plot_acwr_enhanced(acwr)

# With cohort reference
reference <- calculate_cohort_reference(cohort_data, metric = "acwr_smooth")
plot_acwr_enhanced(acwr, reference_data = reference)
} # }
if (FALSE) { # \dontrun{
# Load activities
activities <- load_local_activities("export.zip")
# Calculate ACWR with EWMA and confidence bands
acwr <- calculate_acwr_ewma(
activities,
method = "ewma",
ci = TRUE,
B = 200
)
# Basic enhanced plot
plot_acwr_enhanced(acwr)
# With cohort reference
reference <- calculate_cohort_reference(cohort_data, metric = "acwr_smooth")
plot_acwr_enhanced(acwr, reference_data = reference)
} # }