What is the mapmetadata package?
For researchers working with health datasets, there are many great resources that summarise features about these datasets (often termed metadata) and how to access them. Access to metadata can help researchers plan projects prior to gaining full access to health datasets. Learn more about health metadata in our Health Metadata article hosted on the package website.
One comprehensive open resource is the Health Data Research Gateway, managed by Health Data Research UK in collaboration with the UK Health Data Research Alliance. The gateway can help a researcher address questions such as: What datasets are available? What are the features of these datasets? Which datasets fit my research? How do I access these datasets? How have these datasets been used by the community before, and do they link to others? What publications, or other resources exist, using these datasets?
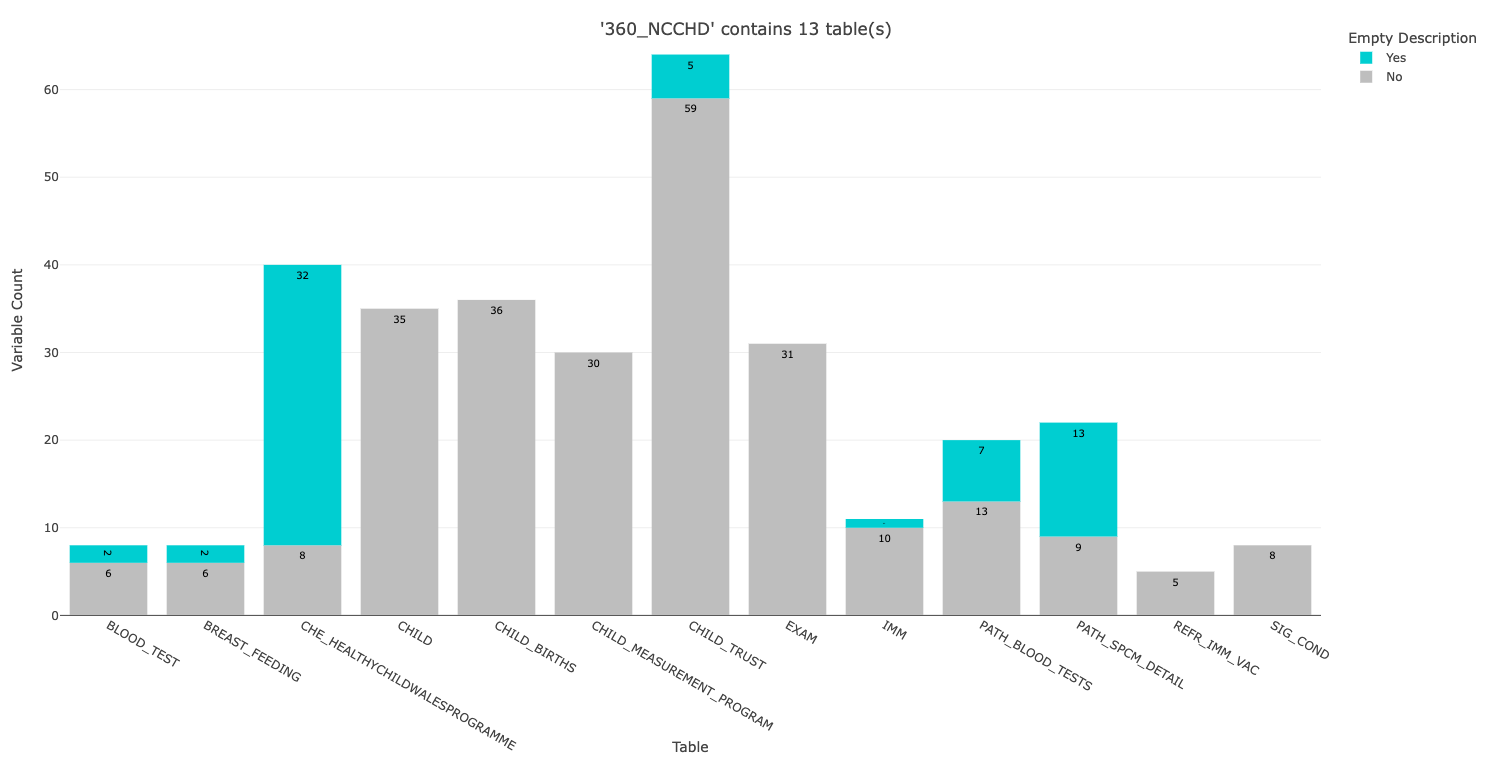
This mapmetadata package uses structural metadata files, downloaded from the Health Data Research Gateway. In theory, any metadata file with the same structure as the the files downloaded from this gateway can be used with this package. The mapmetadata package goes beyond just browsing structural metadata, and helps a researcher interact with this metadata and map it to their research domains/concepts. Firstly, it creates a plot (see example below) displaying number of variables in each table, number of tables, and the completeness of the metadata (i.e. whether the description for each variable in a table exists).
Secondly, it helps the researcher address the question Which variables map onto with my research domains? (e.g. socioeconomic, childhood adverse events, diagnoses, culture and community). The package guides users in mapping each variable into predefined research domains. Research domains could otherwise be called concepts or latent variables. To speed up this manual mapping process, the package automatically categorises variables that frequently occur in health datasets (e.g. ID, Sex, Age). The package also accounts for variables that appear across multiple tables within a dataset and allows users to copy their categorisations to ensure consistency. The output files can be used in later analyses to filter and visualise variables by category.
Getting started with mapmetadata
Installation and set-up
Run in the R console:
install.packages("mapmetadata", repos = "https://ropensci.r-universe.dev")Load the library:
Demo (using the R Studio IDE)
There are three main functions you can interact with: metadata_map, map_compare, and map_convert. For more information on any function, type ?function_name.
The main function is metadata_map and you can run it in demo mode using the files located in the inst/inputs directory:
Terminology used in this package: a dataset can contain one or more tables which contains multiple column variables. It creates a plot at the dataset level, and guides you through an interactive session at the table level, to sort table variables into pre-defined categories/domains.
In the R console you should see:
ℹ Running demo mode using package data files
ℹ Using the default look-up table in data/look-up.rda
ℹ Processing dataset '360_NCCHD' containing 13 tables

ℹ A bar plot should have opened in your browser (also saved to your project directory).
Use this bar plot, and the information on the HDRUK Gateway, to guide your mapping approach.

Enter the table number you want to process:
You can exit here (with Clt-C or Esc) to just get this summary plot, which is saved to your project directory. All outputs from this metadata_map function are saved to your project directory. You can change the save location by adjusting the output_dir argument (an argument means the information given to a function, to alter how it runs). For example metadata_map(output_dir = 'username/sub_directory').
If you continue to the mapping stage, you will see all the tables in this dataset are listed. Select the 4th table for demo purposes:
Enter the table number you want to process:

 1: BLOOD_TEST          2: BREAST_FEEDING       3: CHE_HEALTHYCHILDWALESPROGRAMME
 4: CHILD               5: CHILD_BIRTHS         6: CHILD_MEASUREMENT_PROGRAM
 7: CHILD_TRUST         8: EXAM                 9: IMM
10: PATH_BLOOD_TESTS    11: PATH_SPCM_DETAIL    12: REFR_IMM_VAC
13: SIG_COND

Selection: 4
Add a note for processing this table:
ℹ Processing Table 4 of 13 (CHILD)

Optional note about this table: Demo run
This table has 35 variables (see ‘n of 35’ below) but the demo run will only process the first 5 variables (by default). If it skips over a variable (as is the case with 1, 2 and 3) this means it has been auto-categorised. Variable 4 has not been auto-categorised and is asking you to categorise it. You will be asked to categorise a variable with one (or more) of the numbers shown in the key that has appeared in your plots tab. We input ‘8’ which means ‘Health Info’ as defined by the key. The demo simplifies domains for demonstration purposes; for a research study, your domains are likely to be much more specific e.g. ‘Prenatal, antenatal, neonatal and birth’ or ‘Health behaviours and diet’.
ℹ Table variable 1 of 35 (5 left to process)
ℹ Table variable 2 of 35 (4 left to process)
ℹ Table variable 3 of 35 (3 left to process)
ℹ Table variable 4 of 35 (2 left to process)

VARIABLE ----->  APGAR_1

DESCRIPTION ----->  APGAR 1 score. This is a measure of a baby's physical state at birth with particular reference to asphyxia - taken at 1 minute. Scores 3 and below are generally regarded as critically low; 4-6 fairly low, and 7-10 generally normal. Field can contain high amount of unknowns/non-entries.

DATA TYPE ----->  CHARACTER

Categorise variable into domain(s). E.g. 3 or 3,4: 8
Categorisation note (or press enter to continue): level of asphyxia at birth
Response to be saved is ' 8 '. Would you like to re-do? (y/n): n
Repeat the categorisation for the 5th variable to finish. You will then be asked to review the categorisations:
-
First, you will be shown the auto-categorisations and asked if you want to manually edit them (i.e. override the auto categorisation).
- ‘ALF’ refers to ‘Anonymous Linking Field’ - this field is used within datasets that have been anonymised and encrypted for inclusion within SAIL Databank.
Second, you will be asked if you want to review your own categorisations. Select Yes(1) and follow the instructions.
You can use the output file from the metadata_map() function as input for subsequent analysis to filter and visualise variables by research domain. For more information on custom inputs (metadata file, domain list and lookup) and how to understand the outputs, see the mapmetadata tutorial page on the package website.
License
This project is licensed under the GNU General Public License v3.0 - see the LICENSE file for details.
For more information, refer to GNU General Public License.
Citation
To cite mapmetadata in publications:
Stickland R (2025). mapmetadata: map health metadata onto predefined research domains. R package version 4.0.1.
A BibTeX entry for LaTeX users:
Contributing
Please note that this package is released with a Contributor Code of Conduct. By contributing to this project, you agree to abide by its terms.
We welcome diverse contributions to mapmetadata. Please read our Contribution Guidelines for details on how to contribute.
- Report Issues: Found a bug? Have a feature request? Report it on GitHub Issues.
- Submit Pull Requests: Follow our Contribution Guidelines for pull requests.
- Feedback: Share your thoughts by opening an issue.
Contributors ✨
Thanks go to these wonderful people (emoji key):
 Rachael Stickland 🖋 📖 🚧 🤔 📆 👀 💻 |
 Batool Almarzouq 📓 👀 🤔 📆 📖 |
 Mahwish Mohammad 📓 👀 🤔 |
 Daniel Delbarre 🤔 📓 |
 NidaZiaS 🤔 |
 Maëlle Salmon 🤔 💻 |
 Zoë Turner 🤔 📓 |
 Yohann Mansiaux 🤔 📓 |
This project follows the all-contributors specification. Contributions of any kind are welcome!
Acknowledgements ✨
Thanks to the MELD-B research project and the SAIL Databank team for ideas and feedback. Thanks to the Health Data Research Gateway, and the participating data providers, for hosting open metadata.
This project was created by the AI for Multiple Long Term Conditions Research Support Facility (AIM-RSF). AIM RSF is funded by the NIHR Artificial Intelligence for Multiple Long-Term Conditions (AIM) programme (NIHR202647). The views expressed are those of the author(s) and not necessarily those of the NIHR or the Department of Health and Social Care.