Basic graph creation using the template specified in theme_Publication.
Source:R/Graphics.R
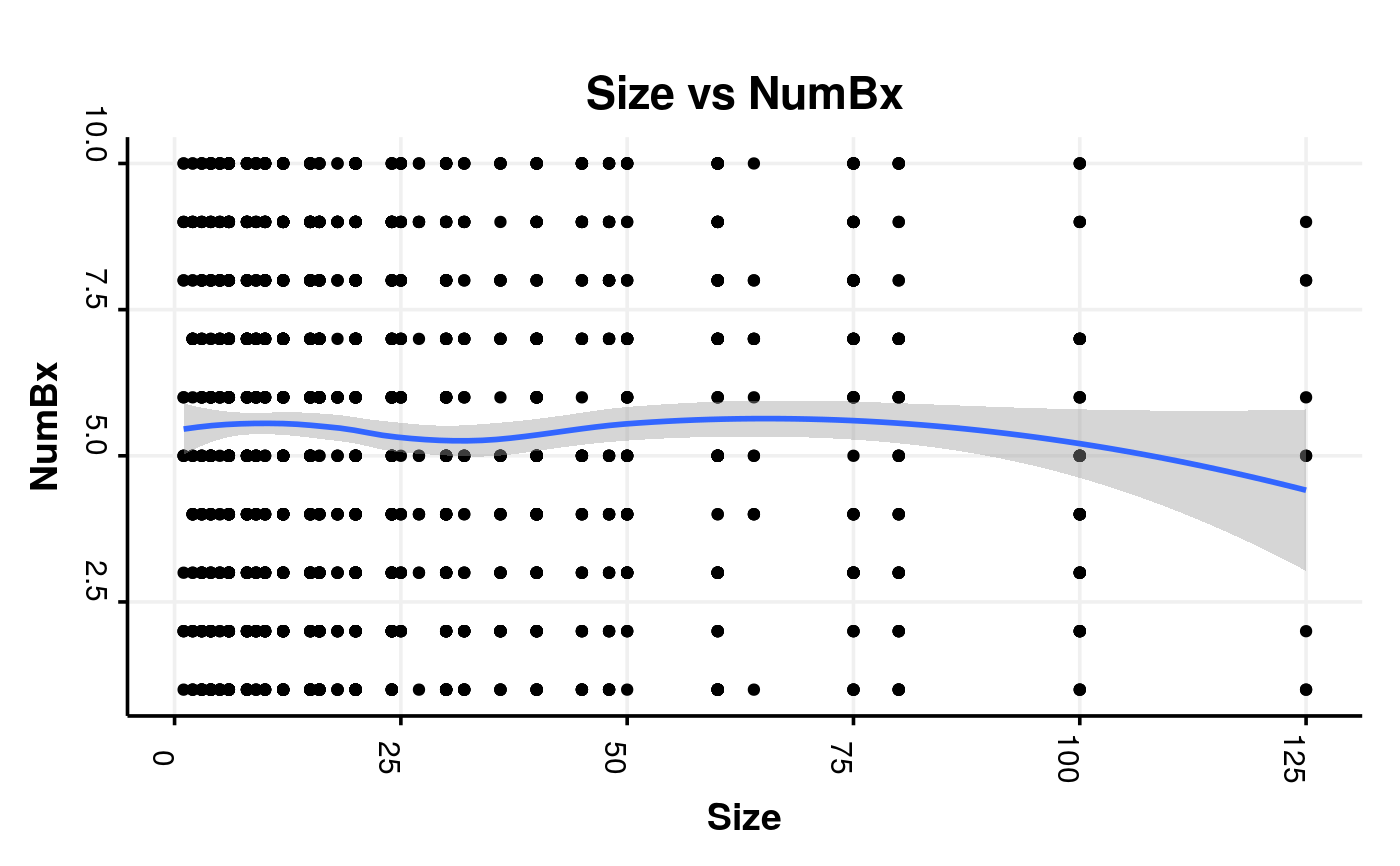
EndoBasicGraph.RdThis creates a basic graph using the template specified in theme_Publication. It takes a numeric column and plots it against any non-numeric x axis in a ggplot
EndoBasicGraph(dataframe, xdata, number)
Arguments
| dataframe | dataframe |
|---|---|
| xdata | The x column |
| number | The numeric column |
Value
Myplot This is the final plot
Myplot
See also
Other Data Presentation helpers:
scale_colour_Publication(),
scale_fill_Publication(),
theme_Publication()
Examples
# This function plots numeric y vs non-numeric x # Get some numeric columns e.g. number of biopsies and size Mypath$Size <- HistolBxSize(Mypath$Macroscopicdescription) Mypath$NumBx <- HistolNumbOfBx(Mypath$Macroscopicdescription, "specimen") Mypath2 <- Mypath[, c("NumBx", "Size")] EndoBasicGraph(Mypath, "Size", "NumBx")#> Warning: `legend.margin` must be specified using `margin()`. For the old behavior use legend.spacing#>